Using Wi-Fi Analytics to Understand Retail Customer Behavior
Turn your guest Wi-Fi into a powerful analytics tool to track foot traffic, dwell time, and customer patterns.
WiFi Data: The Retail Intelligence Layer
Every customer who connects to your store WiFi generates valuable behavioural data — visit frequency, dwell time, peak hours, and return patterns. This is the same type of insight that e-commerce businesses have had for years, now available for physical retail.
Unlike footfall counters or camera-based analytics, WiFi analytics tie directly to individual customer profiles (with consent), enabling personalised marketing at scale.
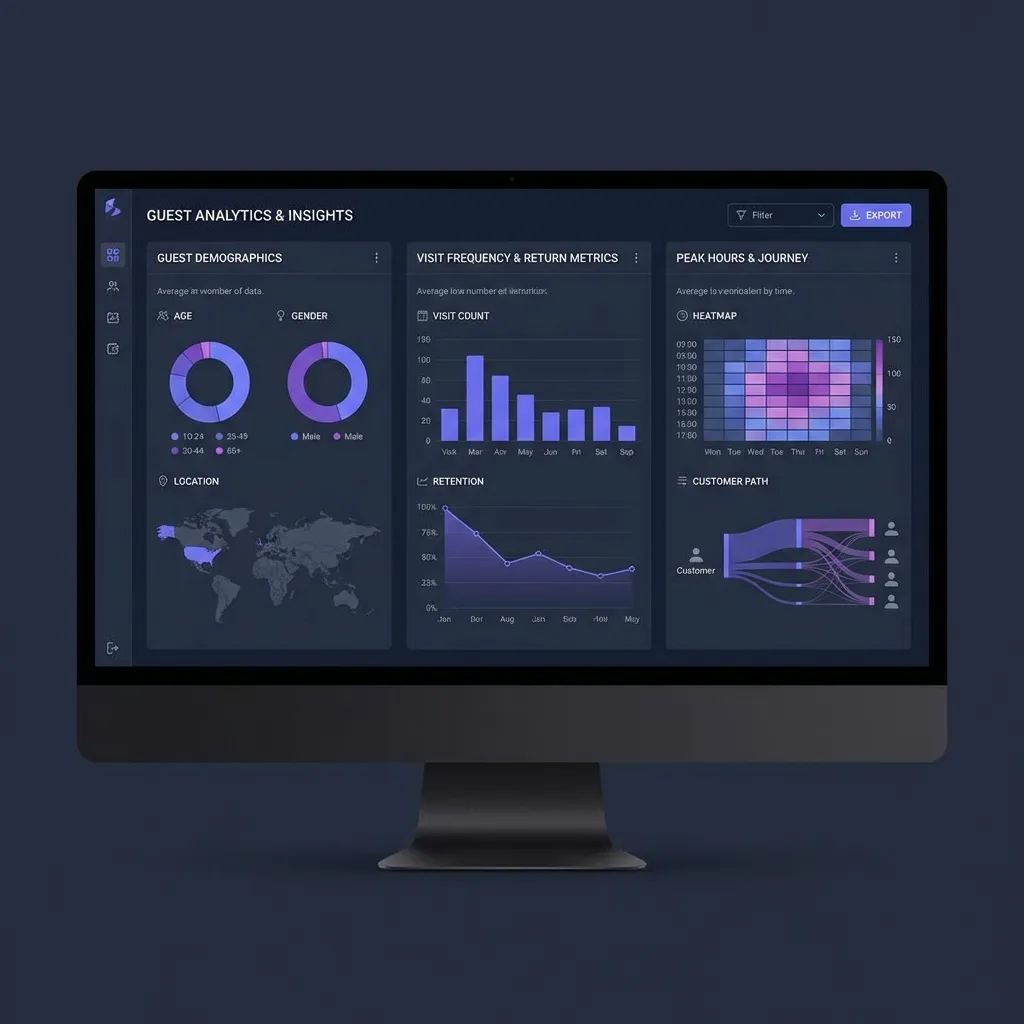
What WiFi Analytics Can Measure
1. Foot Traffic Analysis
Track how many unique visitors connect to your WiFi per day, week, and month. Unlike door counters, WiFi analytics distinguish between unique visitors and repeat visits.
- Identify which days drive the most traffic
- Compare foot traffic across store locations
- Measure the impact of promotions on store visits
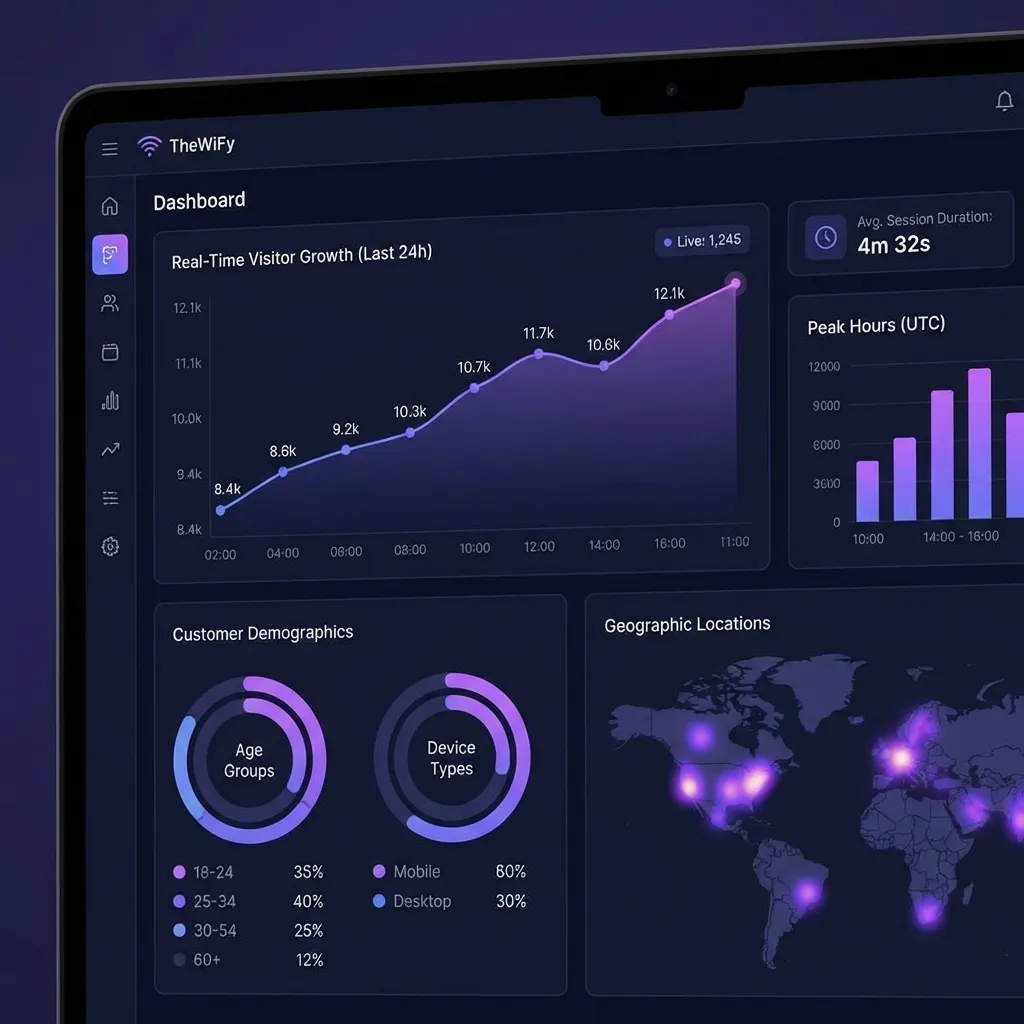
- Track year-over-year trends for seasonal planning
Real-time analytics dashboard showing visitor trends and patterns.
2. Dwell Time Insights
Dwell time — how long a customer stays — is one of the strongest indicators of purchase intent. WiFi session data measures this automatically:
- Short visits (under 5 min) — browse and leave. May indicate pricing or stock issues.
- Medium visits (5-20 min) — active shopping. Optimal conversion window.
- Long visits (20+ min) — engaged customers or those waiting for service.
📈 Insight
Retailers using WiFi dwell time data report a 15-20% improvement in staff scheduling efficiency by aligning coverage to peak engagement windows rather than just headcount.
3. Return Visit Tracking
Repeat visitors are your most valuable customers. WiFi analytics identify them automatically:
- Track visit frequency per customer (weekly regulars vs monthly visitors)
- Measure average days between visits
- Identify customers who haven't returned (lapsed visitors)
- Trigger automated win-back campaigns for lapsed visitors
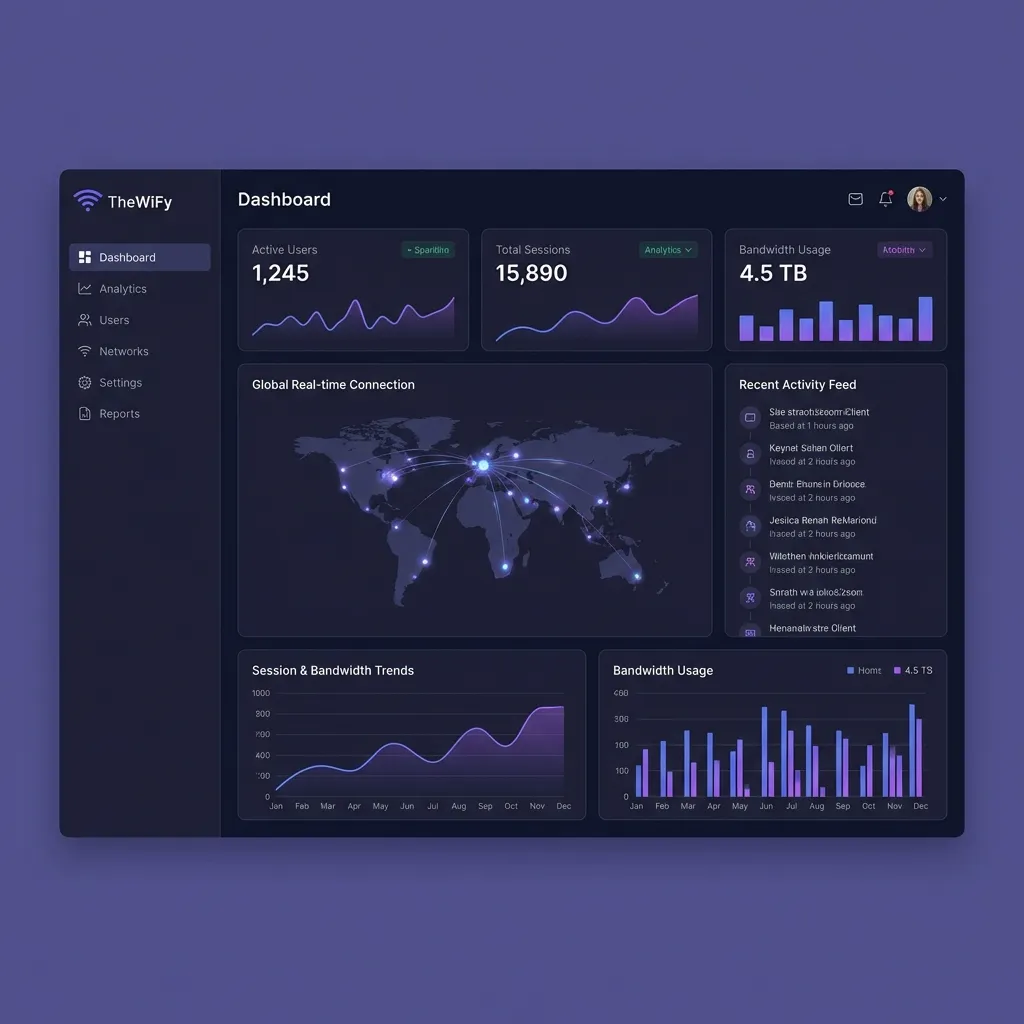
4. Multi-Location Comparison
For retail chains and shopping centres, WiFi analytics enable cross-location benchmarking:
- Compare foot traffic across stores normalised by area or staff count
- Identify which locations have the highest dwell time (best customer engagement)
- Spot underperforming locations early
- Track customer overlap between locations (how many visit multiple stores)
Compare performance across locations from a single dashboard.
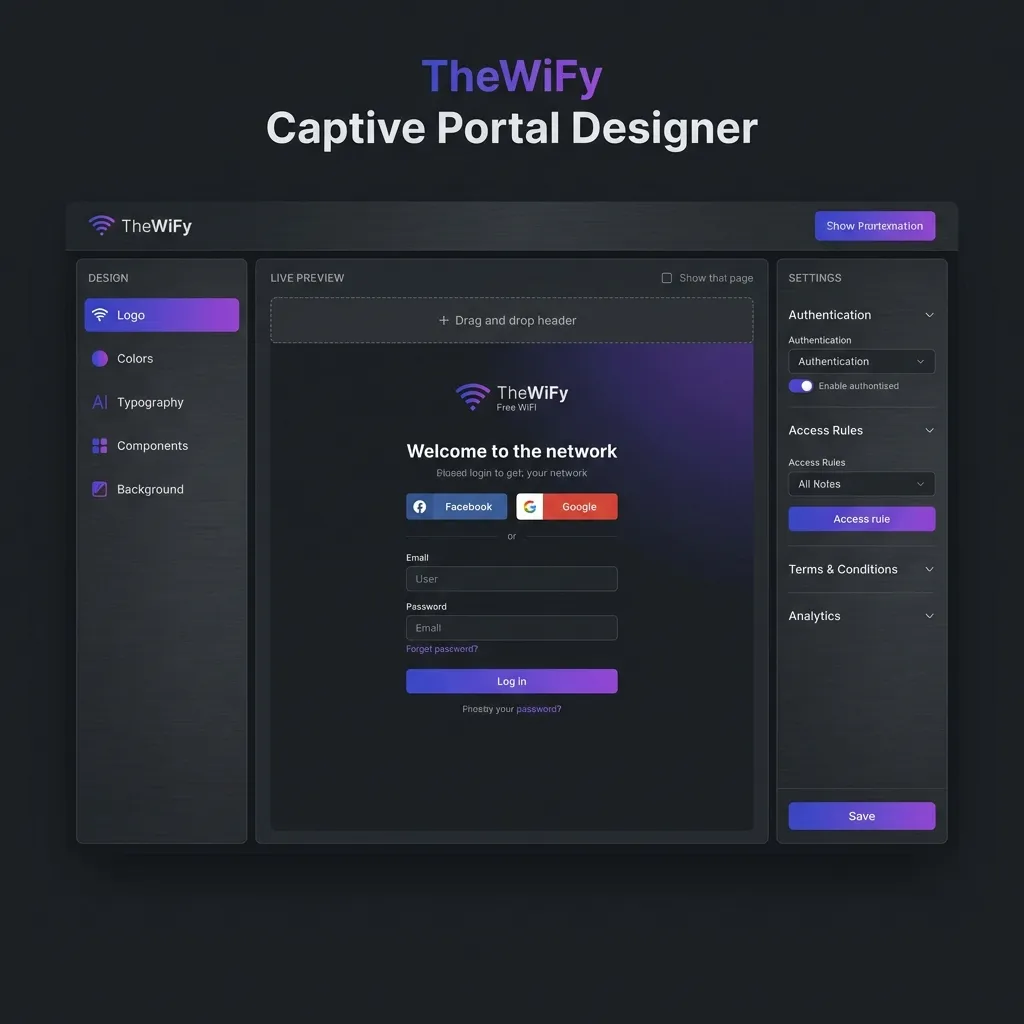
5. Splash Page as a Promotion Channel
The captive portal splash page is seen by every WiFi user. Use it to drive in-store behaviour:
- Display current sales and promotions
- Show personalised offers based on visit history (returning customers)
- Promote loyalty programme sign-up
- Cross-promote other locations or online store
- Sell ad space to tenants (for shopping centres)
Privacy and Consent
All WiFi analytics must be collected with user consent. Best practices:
- Clear privacy notice on the captive portal explaining what data is collected
- Opt-in checkbox for marketing communications
- Anonymised analytics for aggregate reporting (no PII required for foot traffic counts)
- Data retention policy aligned with GDPR (auto-delete after 12 months)
- Guest data export and deletion on request
Getting Started with Retail WiFi Analytics
Unlock WiFi Analytics
Track foot traffic, dwell time, and guest behaviour across all your locations.
See Analytics FeaturesRelated Articles
Complete Guide: Setting Up Guest Wi-Fi on MikroTik with TheWiFy
Step-by-step tutorial to configure secure guest Wi-Fi on your MikroTik router using TheWiFy's cloud authentication engine.
Captive Portal Design: Best Practices for Guest Wi-Fi
Learn how to create branded, conversion-optimized captive portals that enhance guest experience and collect valuable data.
Guest Wi-Fi Security & Compliance: Everything You Need to Know
Comprehensive guide to securing your guest Wi-Fi network and ensuring GDPR, HIPAA, and PCI-DSS compliance.